This chapter is all about tables. We have to learn the parts, merits, and kinds of tables. Here are the tabular presentation of data class 11 notes.
Topics Discussed
Tabular Presentation
Data are a part of the text of the study or a part of the description of the subject matter of study.
Suitability
A small volume of data presented as a part of the subject matter of study became useful supportive evidence to the text.
Tabular Presentation
It involves the orderly & systematic presentation of numerical data in a form designed to elucidate the problem under consideration.
Components of a Table
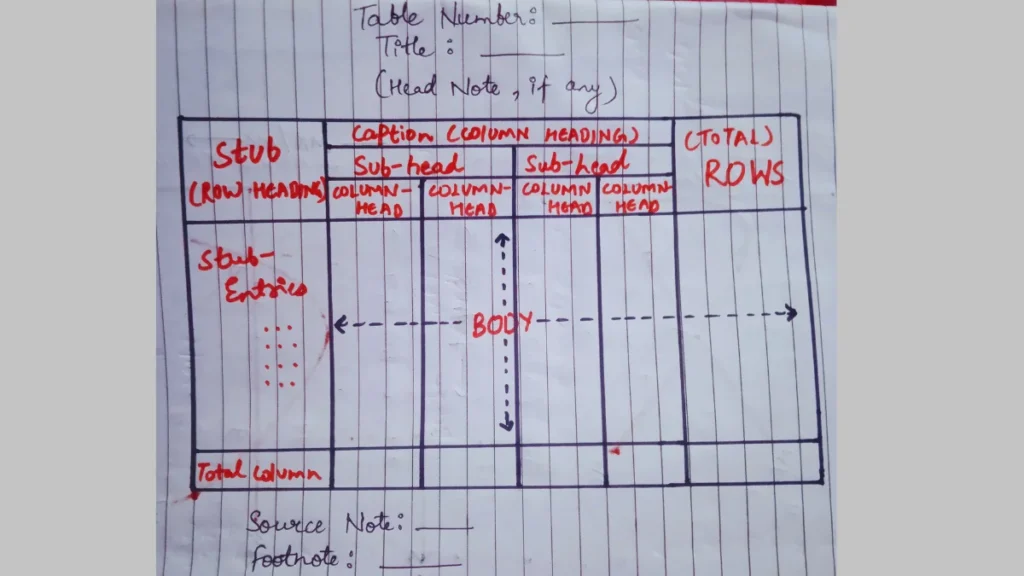
Although there are many parts of a table but main parts of a table are these:
- Table Number: This is a unique number given to a table for ease of finding it. This is usually like 5.1 showing the number one table in chapter 5 of any book.
- Title: It shows what the table is all about. For example: If the table title is Heights of Students then it shows the table is all about the height of students.
- Stubs: This is used to tell what all the rows are about. For example: If three rows are showing Science, Commerce, and Arts then Stub would be showing Streams.
- Caption: This is almost the same as stubs but it shows the columns heading.
- Body or Field: This is where the main content comes from. A major detail of a table is shown in this part.
- Head Note: It is to be read before the table but after the title.
- Source Note: It shows where the information in the table has been taken from.
- Foot Note: These show the additional information apart from the table but related to the topic.
Collection of Data Class 11 Notes
Features of a Good Table
Features of a good table are as follows:
- Title as compatible with the objective of the study.
- There must be headings in the table.
- A good table should include abbreviations.
- There should be footnotes in the table for interested readers.
- The total should be there in the Table.
- A good table includes percentages and ratios.
- A good table also tells the source of data used in the table.
- It should be simple, economical & attractive.
Kinds of Table
Tables According to Purpose
- General Purpose Table
- Special Purpose Table
Tables According to Originality
- Original Table
- Derived Table
Tables According to Construction
- Simple way or one-way table
- Complex table
- A double or two-way table
- Treble Table
- Manifold Table
Classification of Data and Tabular Presentation
- Qualitative Classification of Data and Tabular Presentation
- Quantitative Classification of Data and Tabular Presentation
- Temporal Classification of Data and Tabular Presentation
- Spatial Classification
Merits of Tabular Presentation
- Simple and Brief Presentation
- Facilitates Comparison
- Easy Analysis
- Highlights Characteristics of Data
- Economical
Diagrammatic Presentation of Data
Diagrammatic data is a simple & attractive manner in the form of diagrams. Diagrammatic presentation is broadly classified into three types i.e.
- Geometric Form: Bar diagram, Pie diagram.
- Frequency Diagrams: Histogram, Polygon, Ogive.
- Time Series Graph
Bar Diagrams
Bar diagrams are those diagrams in which data are presented in the form of bars or rectangles.
Types of Bar Diagrams
a) Simple Bar Diagram
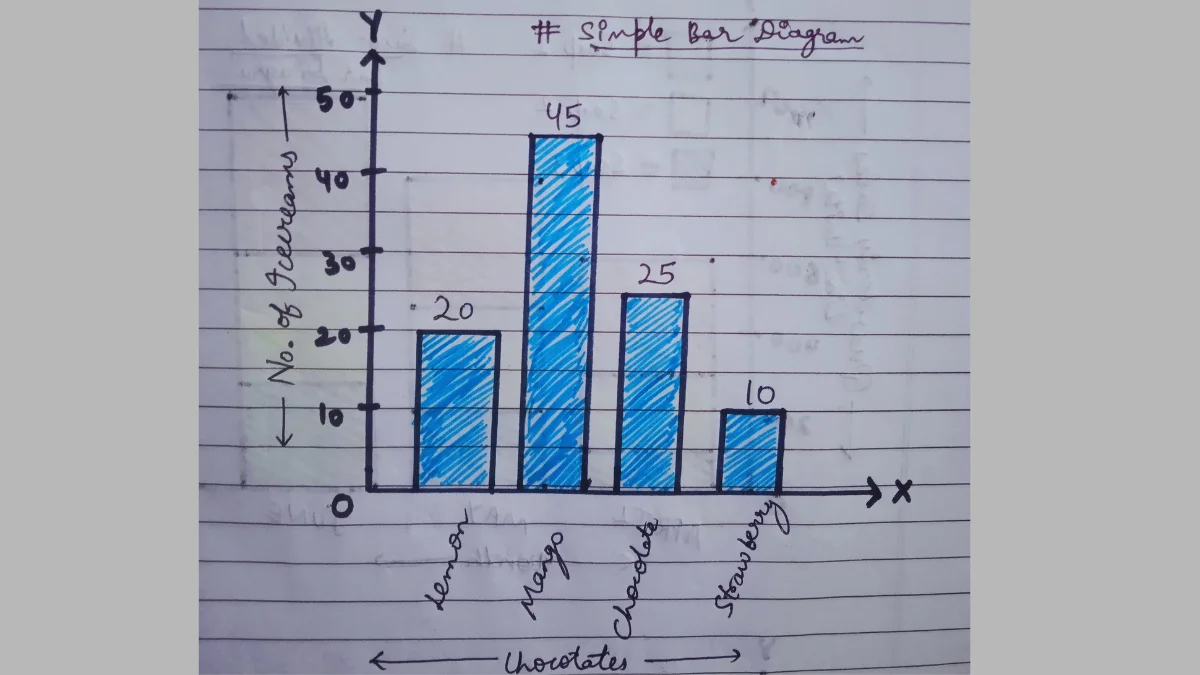
Simple bar diagrams are based on a single set of numerical data. The different items or values are represented by different bars.
Data related to birth rate, death rate, production level, etc. are generally presented as a simple bar graph.
b) Multiple Bar Diagram
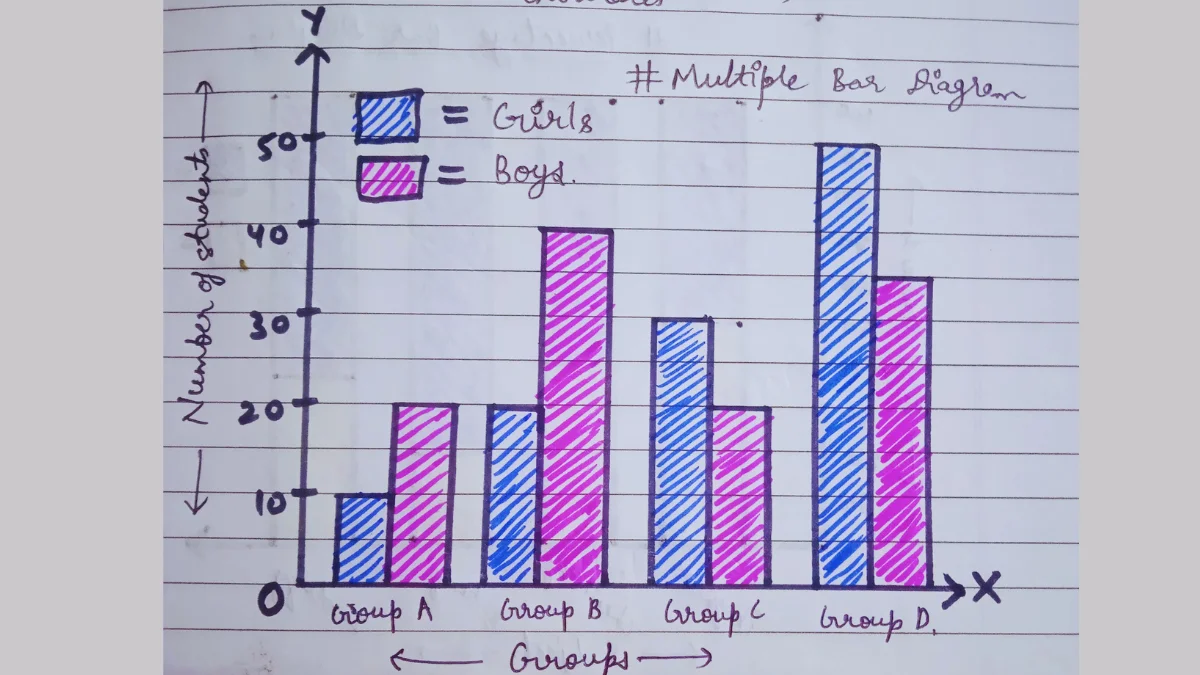
Diagrams that show two or more sets of data simultaneously are called multiple bar diagrams.
Generally, these diagrams are used to compare two sets of series, such as the birth rate or death rate series.
Separate bars are drawn to present separate sets of values.
c) Sub-Divided Bar Diagram
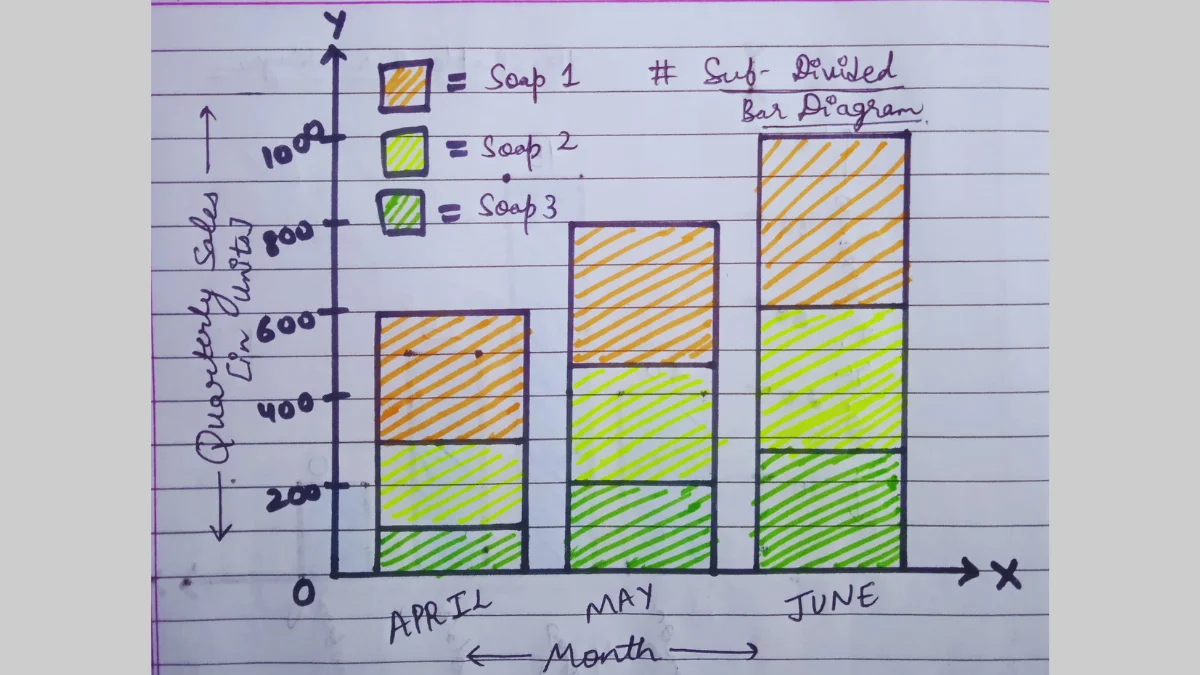
Diagrams that simultaneously present, total values as well as part values of a set of data are known as sub-divided bar diagrams.
Different parts of the bars are shaded with colors. Different parts of the bars must be shown in the same order for all diagram bars.
d) Percentage Bar Diagram
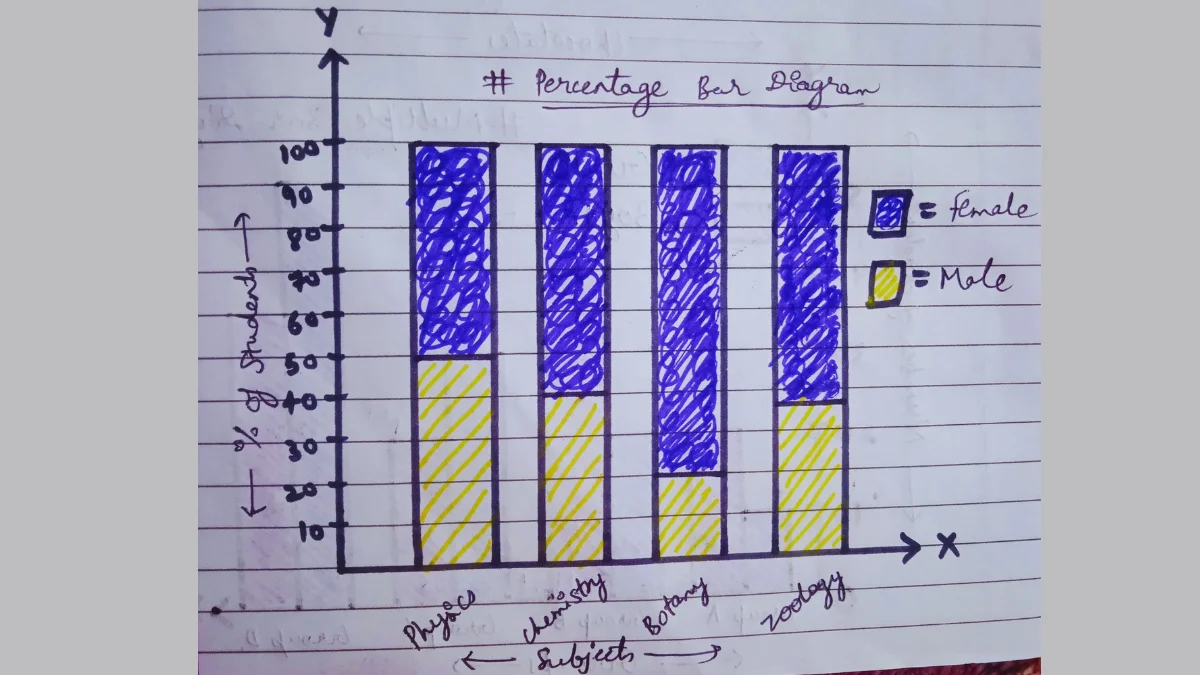
The percentage bar diagram shows simultaneously different parts of the values of a set of data in terms of percentages.
The percentage bar diagram is used generally when the values are of high magnitude.
Note: The total value, indicated by the total length of a bar is assumed to be 100. Each part there is shown as a part of 100.
This was all about Tabular Presentation of Data Class 11 Notes. If you have any doubts, you can either join my telegram channel or ask your doubts in the comments section.
[…] Tabular Presentation of Data Class 11 Notes […]
[…] Tabular Presentation of Data Class 11 Notes […]